Elliott wave principle is a form of technical analysis that financial traders use to analyze financial market cycles and forecast market trends by identifying extremes in investor psychology, highs and lows in prices, and other collective factors.
Chapter 1
Rules are inevitable and govern all waves to which they apply. They should never be disregarded.
Guidelines are typical, but not inevitable, characteristics of waves. Examples include extension, truncation, alternation, equality channelling, personality, and ratio relationships.
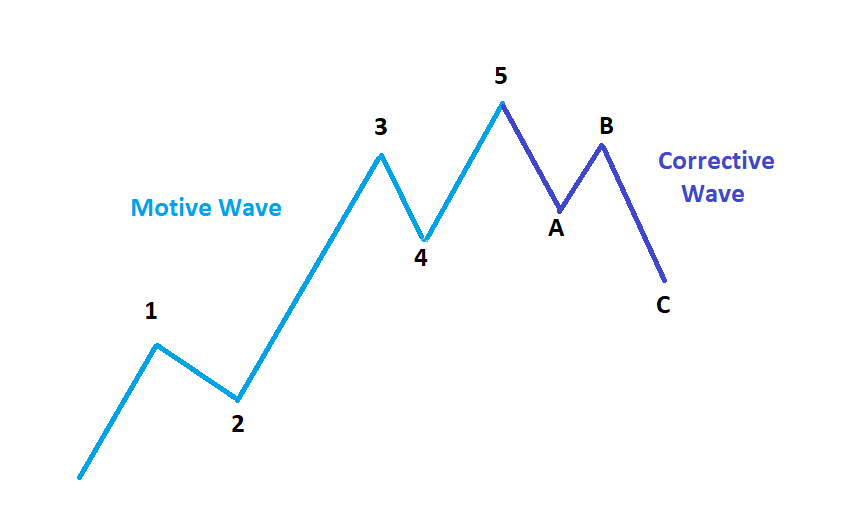
Motive waves subdivide into five waves and their goal is to make progress. There are two types of motive waves: impulse and diagonal triangle.
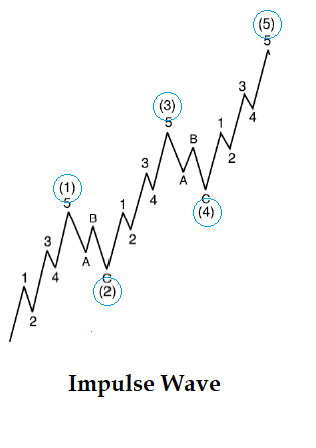
Impulse: (5-3-5-3-5) have the following rules:
- Wave 2 always retraces less than 100% of wave 1, i.e., it does not overlap the start of wave 1.
- Wave 4 always retraces less than 100% of wave 3 and does not overlap the extreme of wave 1.
- Wave 3 is never the shortest among the three actionary waves (1, 3, and 5).
It is not advisable to assign a wave 4 label if there is any overlap of the territory of wave 1 during the 4th wave.
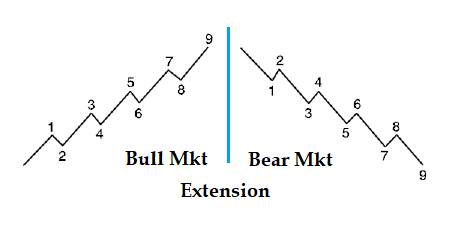
Extension is an elongated impulse with exaggerated subdivisions.
Guidelines:
- Most impulses contain an extension in one and only one of their three actionary subwaves.
- At times, the subdivision of an extended wave is nearly the same amplitude and duration as the other four waves of the larger impulse, giving a total count of nine waves of similar size rather than the normal count of “five” for sequence.
- If waves 1 & 3 are of about equal length (i.e., not extended), expect wave 5 to be extended, especially if the volume is more significant in the 5th wave than the 3rd wave.
- If wave 3 is extended, wave 5 should be constructed and resemble wave 1.
- Extensions can occur within extensions. For instance, 3 of 3 in stock markets and 5 of 5 is uncommon except in bull markets in commodities. 5 wave extension would appear as 9, 13, 17, etc., and 3 wave extension would appear as a 7, 11, 15, etc.
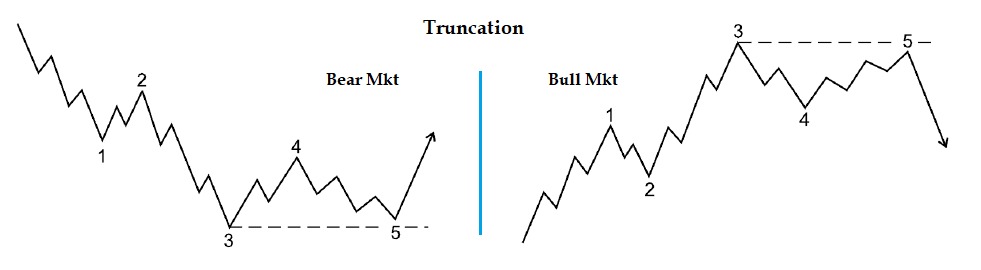
Truncation: A situation in which the fifth wave does not move beyond the end of the third wave, often occurring after a particularly strong third wave. The fifth wave must contain the necessary five sub-waves.
Diagonal triangles (wedges): (3-3-3-3-3 or 5-3-5-3-5)
- Rules:
- Wave 2 always retraces less than 100% of wave 1, i.e., does not overlap the start of wave 1.
- Wave 4 always retraces less than 100% of wave 3 and almost always moves into the price territory of (overlaps) wave 1.
- Wave 3 is never the shortest among the three actionary waves (1, 3, and 5).
- Rare occasions:
- A diagonal may end in a truncation but usually by very slim margins (compounding violence).
- Wave 3 is never a diagonal by itself.
Ending diagonal: (3-3-3-3-3)
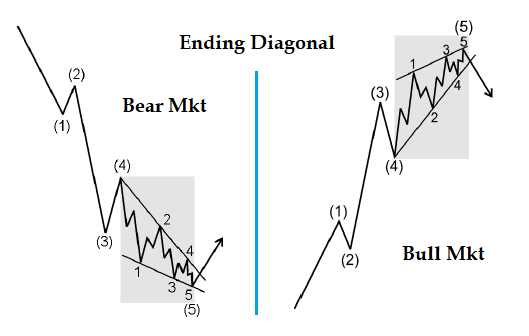
- Guidelines:
- Usually found in the fifth wave position when the initial wave goes “too far too fast.”
- It is at the termination point of a larger pattern, “indicating exhaustion of the larger movement.”
- It has a wedge shape within two converging lines and sub-waves are subdivided into “threes,” even the 1st, 3rd, and 5th. All subwaves are zigzags.
- It is a very small percentage of C waves in ABC formations (both zigzag and flat), and in double or triple threes, only the last ending C.
- The 5th wave of a diagonal often ends in a “throw-over.”
- Volume tends to diminish as a diagonal triangle of a small degree progresses; the pattern always ends with a spike of relatively high volume when a throw-over occurs.
- Rare occasions:
- The fifth sub-wave falls short of its resistance trendline (compounding the violence).
- Invalid variation:
- The boundary lines diverge rather than converge, forming an “expanding wedge.”
- Length of the next move (“post ending diagonal”):
- A rising diagonal is bearish, followed by a sharp decline retracing at least back to the start of the move, and the opposite is true for a falling diagonal.
- Fifth wave:
- Extensions, truncated, and ending diagonal all imply the same thing: a dramatic reversal ahead.
- If two of these phenomena occur together at different degrees, this might compound the violence.
Leading diagonal: (3-3-3-3-3 or 5-3-5-3-5)
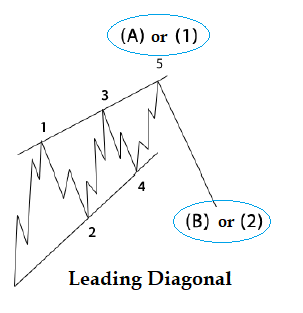
- Rules:
- Appears in wave 1 of an impulse or wave A of zigzags.
- Waves 2 and 4 subdivide into three-wave zigzags; waves 1, 3, and 5 subdivide into zigzags or impulses.
- Guidelines:
- It is a continuation pattern rather than a termination pattern like the ending diagonal.
- A 5-3-5-3-5 formation might usually be in wave A of an ABC correction within a bear market rally.
- Common mistakes: 1-2-1-2 patterns are often mistaken for a leading diagonal; the critical difference is in the slowing of price change in the fifth wave relative to the third wave. Short-term speed typically increases in developing first and second waves, and breadth expands.
- Length of the next move (“post leading diagonal”):
- The next move is deeply retraced, and if it is in wave 1, wave 2 might retrace 78.6%.
Corrective wave: Never subdivides into five-wave patterns and is characterized by choppy, overlapping waves. It can be challenging to recognize a corrective pattern until the move is completed and behind us. An initial five-wave movement against the larger trend is never the end of a correction, only a part of it.
There are four types of corrective waves: zigzag, flat, triangle, and combinations.
Zigzag: (5-3-5)
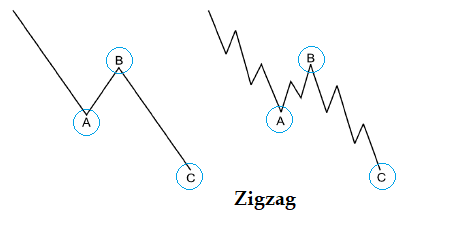
- Rules:
- Wave A is an impulse or a leading diagonal.
- Wave B can be any corrective pattern but never goes beyond the start of wave A.
- Wave C is an impulse or an ending diagonal.
- Guidelines:
- Zigzags are most common in wave 2, while wave 4 is rarely a zigzag.
- If the first zigzag doesn’t retrace sufficiently, there might be a double or triple zigzag.
- Wave C moves sufficiently beyond wave A.
Flat: (3-3-5)
- Rules:
- Wave C is an impulse or an ending diagonal.
- There are three types of flats: regular, expanded, and running.
- Guidelines:
- Flats are most common in wave 4, while wave 2 is rarely a flat.
- The more powerful the underlying trend, the briefer the flat tends to be.
- Wave C generally terminates slightly beyond wave A, except in expanded flats.
Common mistake: If wave B breaks into five waves, then it is no longer a corrective wave; it is the start of an impulse of a higher degree.
Regular flat:
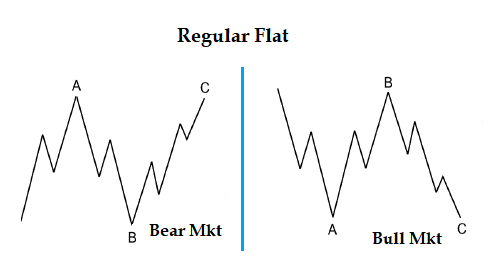
- Wave B terminates at the level of the start of wave A.
- Wave C terminates just slightly past the end of wave A.
Expanded flat: (Far more common)
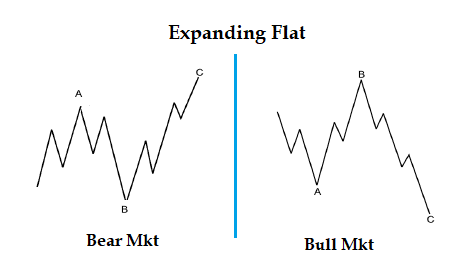
- Contains a price extreme beyond the preceding impulse.
- Wave B terminates beyond the start of wave A.
- Wave C terminates substantially beyond the end of wave A.
Running flat: (Very rare)
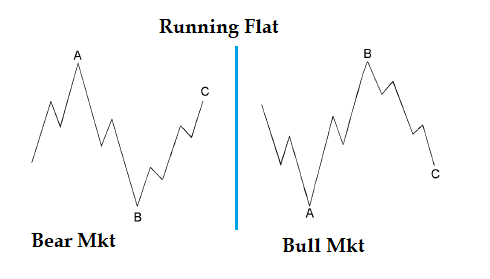
- Wave B terminates beyond the start of wave A.
- Wave C falls short of the end of wave A.
- Usually occurs in strong and fast markets, as wave 3 cannot wait to start.
- A running triangle is more common than a running flat.
Triangle: (3-3-3-3-3)
- Guidelines:
- A triangle is a sideways movement that reflects a balance of forces.
- It is charted by drawing lines between points A and C and points B and D.
- Wave E can undershoot or overshoot the A-C line, but it never goes beyond the end of C.
- A running triangle is very common, where wave B ends well beyond the start of wave A.
- The net retracement of the preceding wave is calculated from the end of wave E.
- Most of the sub-waves are zigzags, but sometimes one sub-wave is more complex, such as a regular flat, expanded flat, or multiple zigzag. This is usually wave C.
- Triangles most often occur before the final actionary wave of a larger degree, such as wave 4, wave B of an ABC correction, or the final X in a double or triple zigzag or combination.
- Sometimes, triangles occur at the final actionary pattern in a corrective combination.
- The length of the following move in equities is typically a swift and short motive wave that travels approximately the distance of the widest part of the triangle.
- On rare occasions, one of the sub-waves, usually wave E, is itself a triangle.
- In extremely rare cases, wave 2 in an impulse might look like a triangle, but it is only a part of and not the entire wave, which is, in fact, a double three.
Contracting triangles:
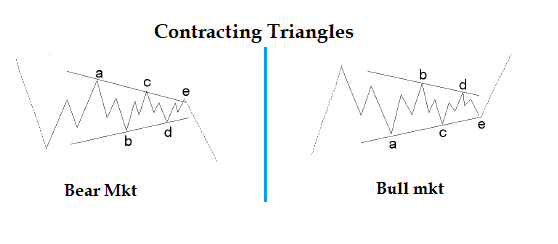
There are three types of contracting triangles: symmetrical, ascending, and descending. Wave E never surpasses the end of wave C, even if it overshoots the trendline.
Expanding triangle “reverse symmetrical”: (Very rare)
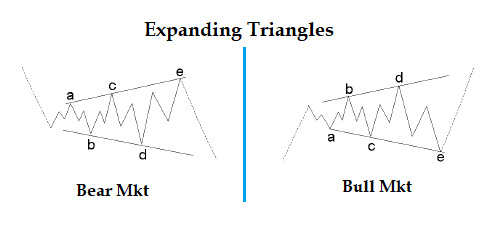
There is no variation in this type of triangle. Wave E moves beyond the end of wave C.
Combination “double and triple threes”:
General horizontal in nature and connected by a “three” wave X. The purpose of a combination is to extend the duration rather than create a deeper retracement. There is never more than one zigzag or triangle in a combination, as zigzags are for deep retracements and triangles in combinations only occur at the final move.
Chapter 2:
Alternation is a guideline of what not to expect. It helps prevent analysts from saying that what happened in the previous cycle will undoubtedly occur again.
Alternation within an impulse:
- If wave 2 is sharp, expect wave 4 to be sideways, and vice versa. This does not apply to diagonals, where alternation of 2 and 4 does not occur.
- A sharp wave never includes a new price extreme, but a sideways wave usually does.
- If wave 2 is sideways, a triangle can appear as wave 4 and still fulfill alternation, but this is less likely. Triangles alternate with other sideways corrections and everything else.
- If wave 2 is simple, expect wave 4 to be a complex combination, and vice versa.
One of the two corrective waves within an impulse will likely contain a move back to or beyond the end of the preceding impulse, i.e., a new high from the orthodox.
Extensions are an expression of alternation. Typically, wave 1 is short, wave 3 is long, and wave 5 is short. If wave 1 is extended, waves 3 and 5 will likely not be extended, and if waves 1 and 3 are not extended, wave 5 will likely be extended.
Alternation within corrective waves
Within corrective ABC waves, if wave A is a flat, expect wave B to be a zigzag, and vice versa.
If wave A is simple, expect wave B to be more complex and wave C to be even more complex. This can be reversed, but it is less common: from wave A, the most complex, to wave C, the least complex
Depth of corrective waves
- Corrective wave 4 tends to retrace within the previous fourth wave of a lesser degree.
- If wave 1 is extended, then the correction following sub-wave 5 will typically have a bottom at the level of the second sub-wave of a lesser degree.
- A flat or triangle following an extension (usually wave 4) will typically fail to reach the wave 4 area by a slim margin.
- Zigzags may occasionally cut deeply and move down into the second wave area of a lesser degree, creating a “double bottom.” This is usually seen in wave 2s.
Behavior following fifth wave extensions
- When wave 5 is extended, the following correction will be sharp and end at the low of the second wave of the extension. The second wave of the extension is close to wave 4 of the original structure.
- This correction can be the entire ABC structure or only wave A.
- Wave B will then be swift and a warning for a deep correction of wave C.
Wave equality
- Two motive waves in a five-wave structure will be equal in time and magnitude.
- If perfect equality is lacking, the next likely relationship is a 0.618 multiple.
- When waves are larger than intermediate degree, the price relationship must usually be stated in percentage terms.
- When waves are of intermediate degree or below, the price relationship must usually be stated in arithmetic terms.
Channeling
- A parallel trend channel typically marks the upper and lower boundaries of impulse waves.
How to channel impulse waves:
- When wave 3 ends, connect waves 1 and 3, and draw a parallel line through wave 2. This provides an estimated boundary for wave 4.
- When wave 4 ends, connect waves 2 and 4, and draw a parallel line through wave 3. This will forecast the end of wave 5.
Alternative method for projecting the end of wave 5:
- If wave 3 is abnormally strong (vertical) and wave 4 is sideways, connect 2 and 4, and draw a parallel line that intersects the extreme of wave 1. This will project the end of wave 5.
Trendlines can also help with zigzags:
- Connect the origin of A with point B, and place a parallel line through point A. This will project the end of C.
If wave 4 moves out of the channel, expect wave 5 to be a throw-over.
Remember: The wave count takes precedence over channel lines and projected Fibonacci targets.
Throw-over
Within a parallel channel or converging lines of a diagonal, if the fifth wave reaches the upper trendline on declining volume, it is an indication that the wave will meet or fall short of it.
If volumes are heavy as the fifth wave approaches the upper trendline, it indicates a possible penetration of the trendline, i.e., “throw-over.”
A throw-over occasionally follows a preceding “throw-under” either by wave 4 or wave two of 5.
During a “throw-over,” it is challenging to identify waves of more minor degrees as channel lines are penetrated.
Volume
- Late in a corrective phase, a decline in volume often indicates a decrease in selling pressure and coincides with a turning point in the market.
- Of the impulse waves, third waves almost always witness the greatest volume. If volume during the fifth wave is as high as the third, expect an extended fifth wave, and this is very useful if both wave 3 and 5 are extended.
- Volume during corrective patterns will generally dry up during triangles and combinations, and will climax during A waves, and during wave 3 of C.
The Right Look
- If wave 4 terminated well above the top of wave 1, a five-wave sequence must be classified as an impulse.
- It is extremely dangerous to accept a wave count representing disproportionate wave relationships or a misshapen pattern.
- The right look may not be evident at all degrees of trend simultaneously, so focus on the degrees that are the clearest.
- You need short-term charts to analyze subdivisions in fast-moving markets and long-term charts for slowly-moving markets.
- When re-working your count, always start from a significant bottom.
- Movements with the larger trend subdivide into 5. Movements against the larger trend subdivide into 3.
- The belief that there is only one direction the market can take and the refusal to consider alternatives is a recipe for trouble.
It’s not over until the fifth of the fifth of the fifth of the fifth is complete. Confirmation that a trend change has occurred of a certain degree comes with a 5-wave move of one lesser degree in the opposite direction.
Summary Table – Motive Wave:
| Number of Subwaves | Volume & Breadth | Characteristics | Market Participants | Technical Indicators | Market View | Following Wave | Note | |
| Wave 1 |
5 Impulse | Increases & technically constructive | Part of the “basing” process | Convinced the trend is lower | “One more rally to sell” | Heavily corrected by 2 | Short selling is evident | |
| Wave 2 | 3 Corrective | Ends On very low volume and volatility, indications of low selling pressure | Deep in the retracements | Thoroughly convinced it’s a bear market | Put/call ratio reduces towards the end | “here we go again” | Massive rally of 3 | Call options sinks drastically towards the end of the wave |
| Wave 3 | 5 Impulse | The greatest volume and price movement | Strong, broad, improving fundamentals | At mid-point trend is confirmed by masses | MACD, RSI peaks, breakouts, continuation gaps, volume expansion & exceptional breadth | Virtually all stocks participate in the rally | Usually sideway 4 | Dow Theory confirms |
| Wave 4 | 3 Corrective | Consolidation and Mostly a balance of forces leading to sideway moves | Predictable in depth and form due to alternation | Building a base for the final move | Lagging stocks build their peak and starts declining | Last final move of 5 | Initial signs of deterioration | |
| Wave 5 | 5 Impulse | Lesser volume than 3 if not extended and slower change in price | In stocks less dynamic than wave 3 | Sticking with their hopes of continuing trend | MACD / RSI show signs of divergence, over-bought signs. | Towards the end, Optimism (pessimism) is at the highest levels despite lower breadth | Start of a Corrective move | Sometimes you might see “blow-offs” or melt-ups. |
Summary Table – Corrective Wave:
| Number of Subwaves | Characteristics | Market Participants | Market View | Technical Indicators | Note | |
| Wave A | 5 wave Zigzag Or 3 wave Flat or Triangle | Sets the stage for wave B | Generally convinced is just a pull back in the original trend | Arrogance and complacence | MACD / RSI deeper at the end of A than during wave 2 or 4 | Public surges to buy, despite the first really technical damages |
| Wave B | 3 waves, if you see 5 waves then it’s a start of an impulse, usually Bs are zigzags and mostly Triangles | Phonies, sucker plays, bull traps, speculators’ paradise and orgies of odd-lotter mentality | “There is something wrong with the market” most probably its wave B | Expressions of dumb intuitional complacency, believing the trend has resumed | Focused on narrow amount of stocks and unconfirmed by other Averages / Indices | Wave X and D in expanding triangles have the same characteristics |
| Wave C | 5 waves impulse and rarely a diagonal, unless part of a triangle | Devastating in their destruction, similar to wave 3 | Towards the end, participants believe it’s a new overall trend. | Illusions of waves A and B tend to evaporate and fear takes over | We might start seeing over sold indicators | |
| Wave D | 3 waves | In all but expanding triangles, volumes tend to increase | This is similar to B, Phonies | |||
| Wave E | 3 waves | Mistaken for a kickoff of a new trend, especially due to the throw-over | The throw-over, intensifies the bearish conviction | Fales break-outs which leads to panic | This is the time where the trader should take the opposite direction | |
| Wave X | 3 waves | It’s a link in the combinations and mostly a zigzag | Signals that the corrective move is not over |
Motive Waves – Fibo Notes:
| Conditions | 1st Possibility | 2nd Possibility | 3rd Possibility | Rich Swannell Difference | Note | |
| Wave 1 | If Extended | Expect net wave 2-5 to be 0.618 x 1 | ||||
| Wave 2 | Sharp | 0.618 x 1 | 0.50 x 1 | If wave 1 is a diagonal 0.786 x 1 | 0.382 x 1 38.2% is twice likely than 61.8% | Wave 4 (net) typically relates to its corresponding wave 2 (net) by a Fibonacci ratio |
| Wave 3 | If Extended | Wave 1 = Wave 5 Or 0.618 relation | Wave 3 = 1.618 x 1 | Wave 3 = 2.618 x 1 | This is usually in Percentage terms | |
| Wave 4 | Sideway | 0.382 x 3 | 0.236 x 3 | Reaches towards the previous wave 4 | In a Diagonal, wave 2 & 4 retrace 0.66 to 0.81 of the preceding waves | Unless wave 1 is extended, wave 4 often divides the impulse in the Golden Ration |
| Wave 5 | If not Extended | Wave 5 = Wave 1 | Wave 5 = 0.618 x (1 to 3) Or 0.382 x (1 to 3) | If Extended 5 = 1.618 x (1 to 3) | Time to complete (1 to 3) = Time to complete (end 3 to end 5) |
- Fibonacci Expansions are more important than Fibonacci Retracements.
- Calculating the ratios has to be done in clusters; three points have to be used, the start, mid, and end of the wave, to calculate/measure the next wave; this is mainly for Fibonacci Expansions.
- The alternation between wave 2 and wave 4 only occurs 61.8% of the time, and if wave 2 is sideways, there is a 78% chance that wave 4 will be sideways too.
Corrective Waves – Fibo Notes:
| Relationship 1 | Relationship 2 | Relationship 3 | Rules and Guidelines | Note | |
| Zigzag | In this order C = A C = 1.618 x A C = 0.618 X A | In this order B retraces 0.618 B retraces 0.5 (In a larger Zigzag) | In this order X retraces 0.618 X retraces 0.5 (In a multiple Zigzag) | B retraces 38% – 79% of A If B is a Zigzag, 50-79% If B is a running Triangle, 10-40% If B is a Triangle, 38-50% | Relationship 1 applies to Double Zigzag as well, i.e. 1st zigzag relative to 2nd zigzag |
| Regular Flat | A = B = C Or very close | B must retrace at least 90% | |||
| Expanded Flat | In this order C = 1.618 x A C overshoots A by 0.618 x A And Rarely C = 2.618 x A | In this order B = 1.236 x A B = 1.382 x A | B retraces 105-138% C expands 100–165% of A | ||
| Contracting Triangle | Alternate Waves C = 0.618 x A D = 0.618 X B E = 0.618 x C | Rarely Adjacent Waves B = 0.618 x A C = 0.618 X B D = 0.618 x C E = 0.618 x D | At least two of the alternate waves are related and rarely adjacent waves are related | ||
| Expanding Triangle | Alternate Waves C = 1.618 x A D = 1.618 X B E = 1.618 x C | Rarely Adjacent Waves B = 1.618 x A C = 1.618 X B D = 1.618 x C E = 1.618 x D | B, C, D retraces at least 100% but not more than 150%, usually 105-125% | ||
| Double Or Triple | The net travel of one simple pattern relates to another by equality | When one of the patterns is a Triangle, second level relation becomes 0.618 |
Good Luck!